

A ‘K-shaped’ recovery isn’t new—but the gap has widened
Higher earners are driving economic growth while lower-income households face rising delinquencies and eroding purchasing power.
5 min read
KEY POINTS
- The U.S. has long exhibited a “K-shaped” economy, but the gap between top earners and the rest has widened significantly over time.
- Inflation has intensified disparities, eroding wage-based purchasing power while boosting asset values largely held by higher-income households.
- Financial stress is increasingly concentrated among lower-income borrowers, with delinquency rates exceeding financial crisis levels despite low unemployment.
The concept of a “K-shaped” recovery has been getting a lot of attention lately—and rightfully so. We would note, however, that a “K-shaped” economy is not new. In fact, a “K-shaped” economy is not a bug of a capitalistic economy; it is a feature. There have always been a range of economic outcomes for participants within capitalism, and not surprisingly, as those achieving a higher level of income drive a larger portion of economic growth.
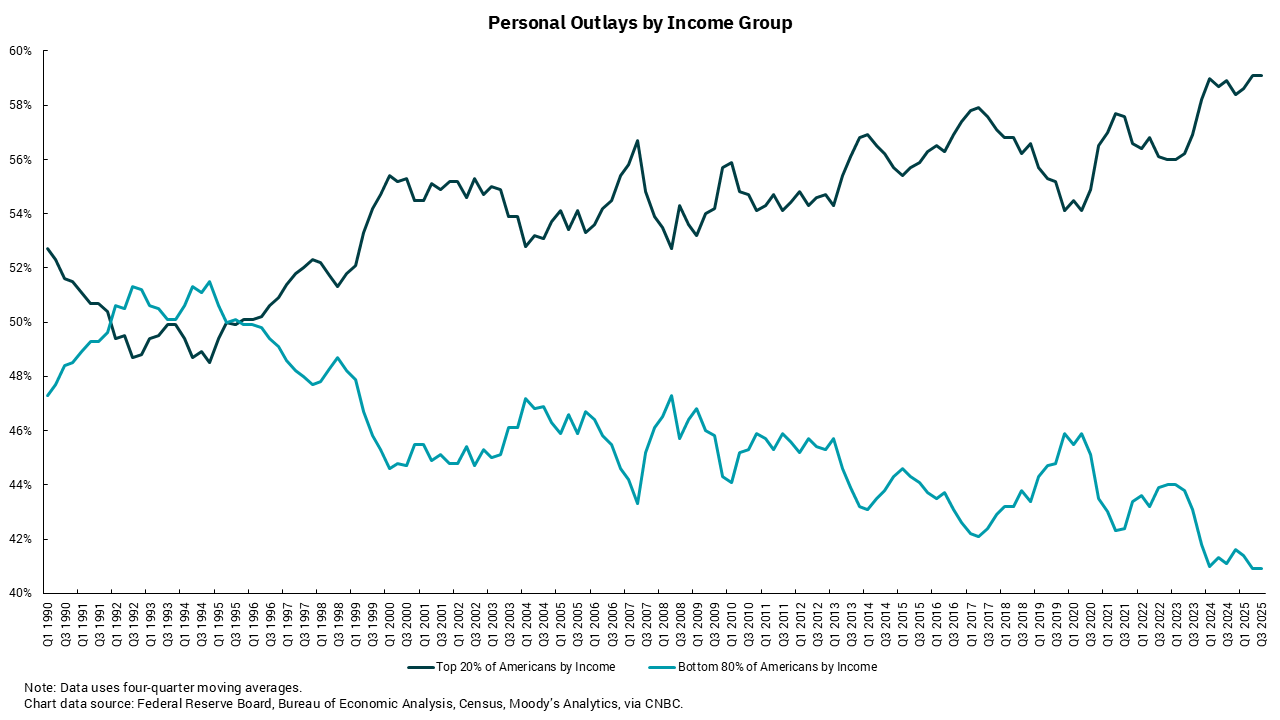
Our chart this week shows the percentage of personal outlays for the top 20% of income earners versus the bottom 80% of income earners. Note that while the early part of this chart shows periods when the bottom 80% were responsible for a bigger portion of outlays than the top 20%, that does not mean that we didn’t have a “K-shaped” economy at that time. The top 20% were still responsible for an outsized level of overall spending. What has changed over the time frame, however, is the degree to which the top 20% differ from the bottom 80%. There are multiple ways we can show a similar trend. Data from the Bureau of Labor Statistics (BLS) show that labor share of national income has been steadily declining for the last 40 years. The offset to this is expanding corporate margins. Neither of these series is a straight line, of course, but the trend is clear.
We can see the impact on consumers if we look at data on debt delinquencies by income quartile or credit score. Lower-income cohorts and borrowers with lower credit scores are currently delinquent on car loans at a rate higher than during the financial crisis when unemployment was 10%! Recall that the current unemployment rate is 4.3%. At the same time, borrowers with higher income and higher credit scores are seeing delinquency rates at or lower than historic averages.
The inflation surge that the U.S. experienced during the pandemic would seem to be a primary culprit in the continuation of these trends. Aggregate wage gains have not kept up with aggregate price increases resulting in a loss of spending power for all wage earners. However, owners of financial assets, like homes and equities, have seen their net worth rise much more rapidly than the rate of inflation. This has not only acted as a cushion to higher inflation, but it also resulted in net worth gains for the top 20%, who own roughly 80% of all the financial assets in this country. The numbers are even tougher for the bottom 50% of wage earners who own less than 5% of total financial assets.
Is it any surprise, then, to see a rise in ideas and election results built around more equal outcomes for consumers? It isn’t the uneven outcomes per se, but likely the dominance, or spread, between the top 20% and everyone else that is the cause of these levels of angst. If we go back to the early parts of this chart when the spread was smaller, we would see lower deficits, lower levels of government spending and reduced levels of economic “financialization.”
That’s not to say the government cannot or should not play a part in how we reverse this trend, but the part it plays might be different than it was in the past. A good first step is to get inflation back down to the Federal Reserve’s 2% target and new Fed Chair Kevin Warsh’s commitment to do so was a welcome development.
Get By the Numbers delivered to your inbox.
Subscribe (Opens in a new tab)